From RAM to revelation: how Windows manages memory and how Volatility reads it
Over the years I have written quite a bit about memory forensics: Volatility cheatsheets, plugin-specific guides, compressed memory analysis, the migration to Volatility 3. But I never got around to writing about how Windows actually manages memory in the first place. Dozens of posts about what to look for in a memory dump, and not one about the substrate those dumps are made of. Time to fix that.

To understand what is really inside a Windows memory image and why Volatility can navigate it at all, we need to go back to fundamentals: how the kernel carves up the address space, what structures it uses to track every allocated region, and why so much forensically relevant information survives in RAM long after an attacker thinks they have covered their tracks.
The illusion of a private, contiguous world
Every Windows process lives inside a virtual address space that the hardware MMU (Memory Management Unit) makes appear contiguous and private, even though it is neither. On a 32-bit system, each process sees 4 GB of virtual memory, split into 2 GB of user space (addresses 0x00000000 to 0x7FFFFFFF) and 2 GB of kernel space. On 64-bit Windows, the user portion grows to 128 TB and the kernel occupies an equally large region above the canonical address boundary, but the conceptual division stays the same: user code cannot touch kernel memory, and kernel memory is shared across all processes.
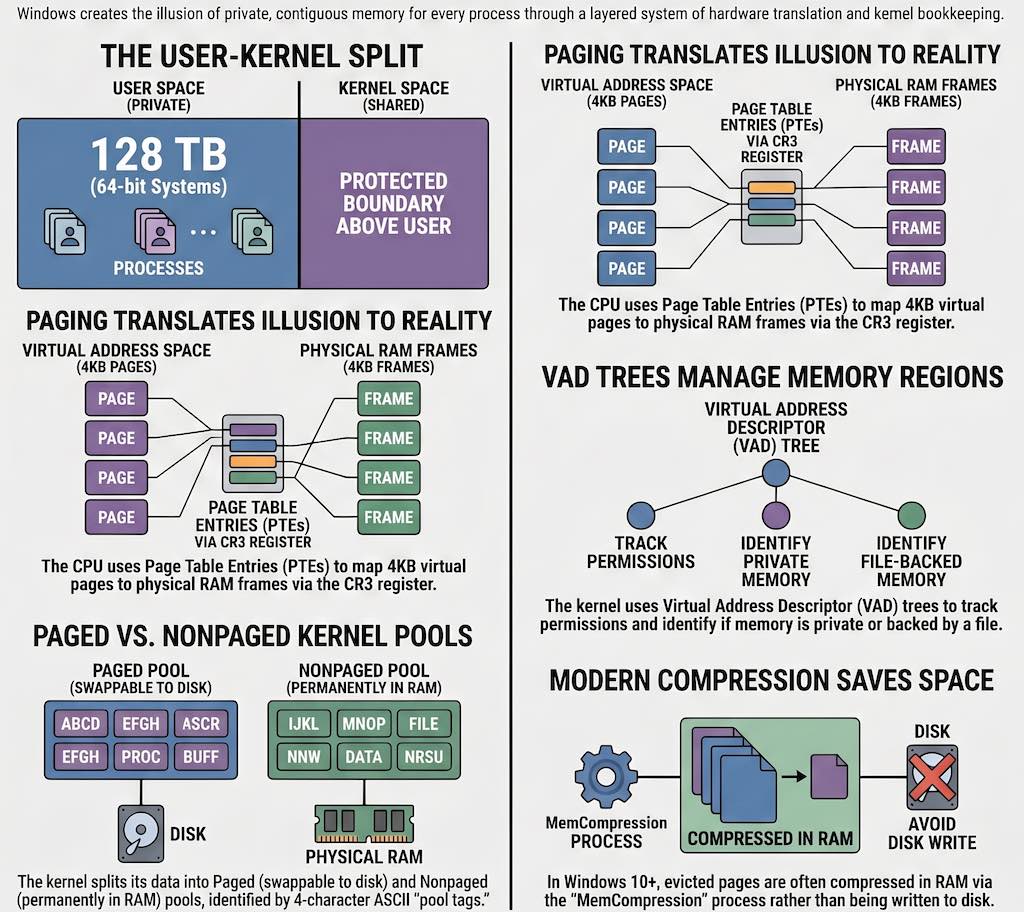
The mechanism that makes all of this work is paging. Physical RAM is divided into 4 KB frames, and the virtual address space is divided into equally sized pages. The processor uses a multi-level structure called a page table to translate each virtual address into a physical one, with each entry in that table called a Page Table Entry (PTE). The root of the per-process page table hierarchy is stored in the control register CR3, which holds the physical address of the page directory. On a context switch, Windows simply updates CR3 and the running process immediately sees a completely different address space, even though no memory has physically moved. To avoid walking these tables on every single memory access, the processor caches recent translations in the Translation Lookaside Buffer (TLB), flushing relevant entries whenever a context switch happens.
Not every PTE points to physical memory currently present in RAM. The Windows memory manager tracks the lifecycle of each page through several distinct PTE states, each carrying its own forensic weight. A valid PTE holds a physical frame number and protection flags, meaning the page is in RAM and accessible. A demand-zero PTE indicates that memory has been reserved but never touched: the physical frame is not allocated until the first access triggers a page fault, at which point the kernel fills the frame with zeros. A transition PTE marks a page recently evicted from RAM whose content has not yet been written to the page file, so it can be reclaimed cheaply. A pagefile PTE records where on disk the evicted content currently lives. Finally, a prototype PTE is used for file-backed shared memory, where multiple processes share the same physical frames through a level of indirection in the form of Prototype Page Table Entries (PPTEs) associated with segment objects. Each of these states matters in practice: a page in transition, for instance, may still be recoverable from a memory dump even if the process that owned it has already exited.
The bookkeeping behind every allocated byte
Above the level of individual PTEs, the Windows kernel maintains a richer set of objects that describe every region of virtual memory in a process. The most important from a forensic perspective is the Virtual Address Descriptor (VAD) tree: a balanced AVL tree embedded in the EPROCESS structure of each process, where each node describes a contiguous range of virtual addresses that share the same protection settings, backing type, and file association. This is extensively documented in the Windows Internals book and forms the backbone of many Volatility plugins.
Enumerating the VAD tree of a process tells you not only what memory regions are allocated, but also which ones are mapped to files on disk and which are purely private. Private executable memory with no file association is the canonical trace of code injection, whether that injection takes the form of classic DLL injection, process hollowing, or reflective loading. A VAD entry combining PAGE_EXECUTE_READWRITE protection with a private backing store and no filename is almost always worth examining.
File-backed memory runs through a more elaborate object hierarchy. When an executable is loaded, Windows creates a section object that references a segment object, which in turn holds the array of PPTEs describing the file content page by page. Multiple processes can map the same section simultaneously, sharing physical frames through this indirection. The segment is also linked to a control area and one or more subsections, one for each PE section in the image (code, data, resources), each carrying its own protection flags. As Carsten Willems’s detailed analysis of Windows memory management internals shows, understanding this hierarchy is essential to interpreting what Volatility reports when it lists loaded modules: each mapped PE image has a corresponding chain of kernel objects that the tool traverses to reconstruct the complete picture.
The kernel also allocates memory for its own internal data through two distinct pools: the paged pool, which can be swapped to disk under memory pressure, and the nonpaged pool, which is always resident in physical RAM. The nonpaged pool holds data that must be accessible even during interrupt processing, including network buffers, I/O request packets, and certain security tokens. Both pools tag every allocation with a four-character ASCII string called a pool tag, and pool scanning (searching raw physical memory for known tags and interpreting the surrounding bytes as the expected structure) is one of the most powerful techniques in memory forensics. The Proc tag historically identified EPROCESS allocations, for example, which is why windows.psscan can find processes that a rootkit has hidden by unlinking them from the active process list.
When Microsoft moved the goalposts
The analysis described above was well-established by the time Windows 7 was in widespread deployment. Modern Windows versions have introduced a set of complications that significantly affect forensic analysis.
The most consequential change is memory compression, introduced in Windows 10. Rather than always paging evicted memory to disk, the Windows 10 memory manager can instead compress evicted pages in RAM and store them in a virtual store managed by a pseudo-process called MemCompression. The store is managed by a kernel component called the Store Manager, which uses its own internal data structures (notably SMKM_STORE and B+ trees) to track and retrieve compressed pages. From the perspective of the page tables, these pages appear as transitions with no corresponding pagefile entry, which means that tools that do not understand the compression format simply skip them. Run windows.psscan on a Windows 10 dump without compression support, and half your EPROCESS structures may just not be there. You get a clean, reassuring, and thoroughly incomplete process list. The FireEye FLARE team published the first public research on this mechanism and contributed the necessary support to Volatility. I covered the practical implications in a dedicated article. Because the Store Manager’s internal structures are undocumented and have changed across Windows 10 builds, each new version of Windows potentially requires updated support code, making this an ongoing challenge for forensic tool developers.
A second complication is structural instability across kernel versions. The layout of key structures like EPROCESS and ETHREAD changes between Windows versions, between service packs, and even between cumulative updates. The offset of a particular field is simply not guaranteed to stay constant. Early Volatility addressed this through profiles, which were dictionaries of offsets compiled from debugging symbols. Volatility 3 replaced profiles with symbol tables derived from Microsoft’s PDB debugging symbols, distributed as pre-built JSON files from the Volatility Foundation symbol server. In principle, this means Volatility 3 is automatically correct for any Windows version for which Microsoft has published symbols, without requiring manual profile construction.
Finally, Kernel Address Space Layout Randomization (KASLR), significantly strengthened starting with Windows 8, ensures that key kernel data structures no longer reside at predictable virtual addresses. (User-mode ASLR had existed since Vista, but the kernel-level randomization added in Windows 8 and later hardened in Windows 10 is what matters most for memory forensics.) Volatility addresses this through heuristics that scan the physical dump for known-good signatures, such as the kernel debugger data block (KDBG), to locate the kernel’s base address and the process list pointer even when those addresses are unknown in advance.
The layer cake inside Volatility 3
Volatility 3 was completely rewritten in Python 3, and its architecture reflects a decade of lessons learned about memory forensics at scale. The official documentation describes three core abstractions that everything else builds on: memory layers, templates and objects, and symbol tables.
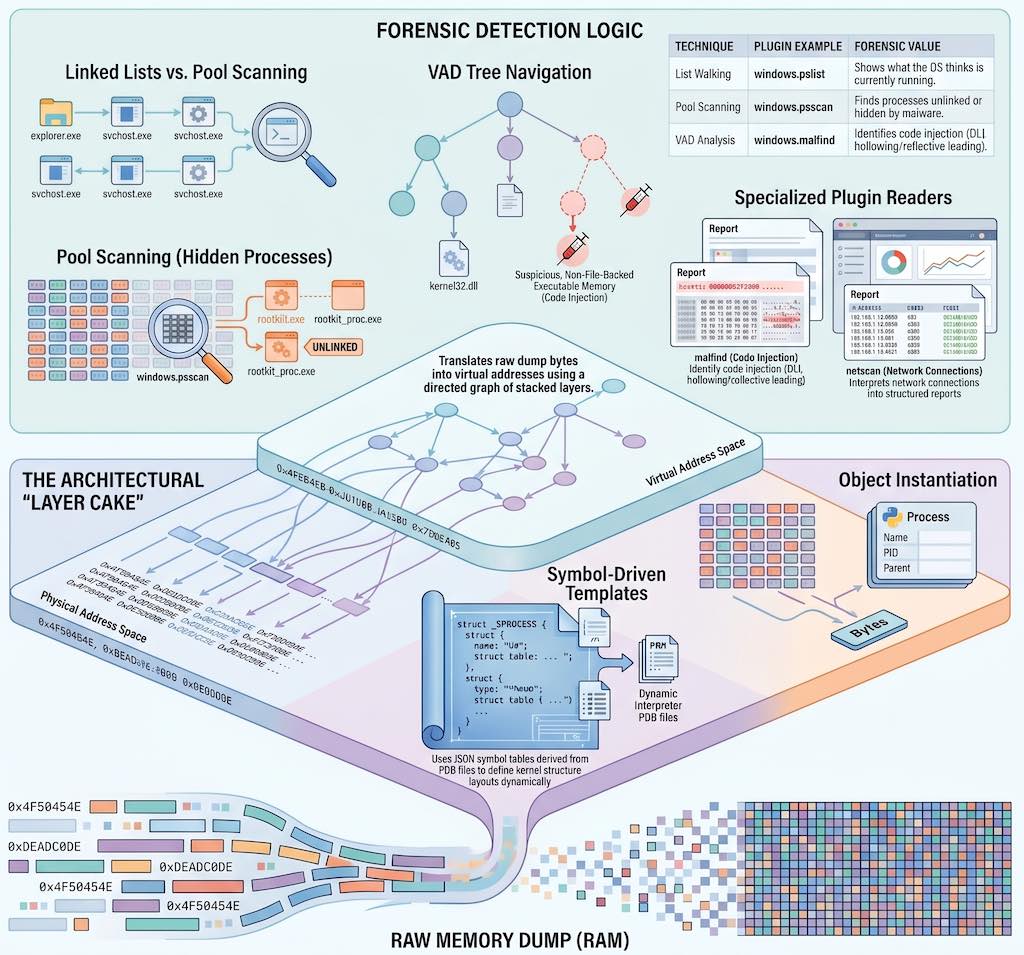
A memory layer is a body of data accessible by address, with the ability to translate addresses from one space to another. Layers are organized as a directed graph. At the bottom sits a physical layer backed by the raw dump file. Above it, a translation layer (for example, an Intel x86-64 paging layer) takes a CR3 value and uses the page tables in the physical layer to translate virtual addresses into physical ones. This stack can grow: a Windows crashdump, for instance, adds a file-format parsing layer below the physical layer that handles the crashdump header and metadata; if a page file is available, a swap layer can be inserted so the Intel translation layer falls back to disk when it encounters a pagefile PTE. Each layer implements the same interface, so from a plugin’s perspective, requesting bytes at a virtual address works identically regardless of how many layers are involved. As the Volatility 3 basics documentation explains, this is a significant architectural improvement over Volatility 2’s address spaces, which could only stack linearly.
On top of the layer graph, Volatility uses templates and objects to give meaning to raw bytes. A template describes the layout of a kernel structure (its size, its fields, their types and offsets) without containing any actual data. An object is a template instantiated at a specific offset within a specific layer: it reads the bytes from the layer and exposes them as Python attributes. Pointer fields return new objects, following the chain automatically. Traversing a doubly-linked list of EPROCESS structures in a plugin is therefore just a loop that follows the ActiveProcessLinks field, with all the virtual-to-physical translation happening transparently in the background.
The templates themselves come from symbol tables. Volatility 3 reads symbols from JSON files generated from Microsoft’s PDB debugging symbols, and uses a module-qualified naming convention (nt!_EPROCESS, tcpip!_TCP_ENDPOINT, and so on) to reference types and constants across multiple loaded tables. Before any plugin runs, a set of automagic routines performs the setup work: scanning the physical dump for the kernel’s Directory Table Base (DTB) to locate the page directory, fingerprinting the kernel image to identify the correct symbol table, and assembling the full layer stack. Plugins receive this fully configured context without having to perform any of that work themselves.
What the plugins are actually reading
With that infrastructure in place, each Volatility plugin is essentially a specialized reader of a specific part of the kernel’s object graph, returning results as a TreeGrid that can be rendered as text, CSV, JSON, or SQLite.
Process analysis starts with windows.pslist, which walks the PsActiveProcessHead doubly-linked list to enumerate live processes, and windows.pstree, which organizes the same data hierarchically by parent-child relationships. The essential counterpart is windows.psscan, which ignores the linked list entirely and instead scans the physical dump for EPROCESS pool tag allocations. Comparing the two outputs is a classic rootkit detection technique: any process visible in psscan but absent from pslist has been unlinked from the active list and is almost certainly malicious. In practice, the first thing I do with a fresh dump is run both and diff the output; more than once that simple comparison has immediately revealed a hidden backdoor process. windows.cmdline extracts the full command line from each process’s Process Environment Block (PEB), and windows.dlllist traverses the InLoadOrderModuleList in the same structure to enumerate loaded modules, as I covered in detail in the processes and DLLs cheatsheet.
Memory region analysis centers on windows.vadinfo, which traverses the VAD tree of every process and reports each allocated region with its address range, protection flags, and file association. windows.malfind automates the most forensically productive use of that data: it filters for regions that combine executable permissions, private backing store, and the absence of any mapped file, then examines the first bytes at each candidate for PE headers or shellcode. Almost every injection technique in common use (hollow process, reflective DLL loading, manual PE mapping, shellcode stubs) leaves exactly this kind of footprint, which is why malfind remains one of the most reliable first-pass detection tools in the Volatility ecosystem. I demonstrated how this applies to Cobalt Strike beacon detection in a dedicated article. For targeted hunting when you already know what you are looking for, windows.yarascan applies YARA rules directly to process or kernel memory, bypassing the file system entirely.
Kernel-level analysis uses windows.modules to enumerate loaded kernel modules from the PsLoadedModuleList, with windows.driverscan providing the pool-scan alternative, the same list-vs-scan comparison that reveals hidden kernel modules just as psscan reveals hidden processes. windows.ssdt dumps the System Service Descriptor Table, the traditional target for kernel-mode hooking rootkits. windows.callbacks enumerates the kernel callback arrays that Windows exposes for process creation notification, image load notification, and registry operations, which are used both by legitimate security software and, occasionally, by malware. The kernel memory and objects plugins I described in the part 4 cheatsheet cover these structures in more practical depth.
Network forensics relies on windows.netstat and windows.netscan, which recover active and recently closed TCP and UDP connections from kernel network structures. Because connection records persist in the nonpaged pool for a period after a connection closes, the dump often provides a picture of network activity that extends beyond the instant of capture. Registry analysis through windows.registry.hivelist, windows.registry.printkey, and windows.registry.userassist reads hive structures directly from memory-mapped pages, recovering registry data that a rootkit may have hidden from the live API. And windows.filescan, which scans for FILE_OBJECT pool allocations, combined with windows.dumpfiles, which extracts their content from memory-mapped pages, is frequently the only way to recover malware payloads that were loaded and immediately deleted from disk.
One thing worth noting: none of these plugins do anything magical. They read the same kernel structures that Windows itself maintains to do its job, using the same symbol information the original compiler produced. Acquiring the dump in the first place (with tools like WinPmem, DumpIt, or FTK Imager) is a separate discipline, but once you have a good image, everything described here is available to you. The commands are the easy part. Knowing what they walk through is what makes the difference.